


When an alternator produces AC voltage, the voltage switches polarity
over time, but does so in a very particular manner. When graphed over
time, the “wave” traced by this voltage of alternating polarity from an
alternator takes on a distinct shape, known as a sine wave: Figure below

Graph of AC voltage over time (the sine wave).
In the voltage plot from an electromechanical alternator, the change from one polarity to the other is a smooth one, the voltage level changing most rapidly at the zero (“crossover”) point and most slowly at its peak. If we were to graph the trigonometric function of “sine” over a horizontal range of 0 to 360 degrees, we would find the exact same pattern as in Table below.
Trigonometric “sine” function.
The reason why an electromechanical alternator outputs sine-wave AC is due to the physics of its operation. The voltage produced by the stationary coils by the motion of the rotating magnet is proportional to the rate at which the magnetic flux is changing perpendicular to the coils (Faraday's Law of Electromagnetic Induction). That rate is greatest when the magnet poles are closest to the coils, and least when the magnet poles are furthest away from the coils. Mathematically, the rate of magnetic flux change due to a rotating magnet follows that of a sine function, so the voltage produced by the coils follows that same function.
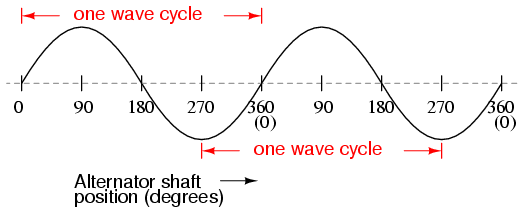
If we were to follow the changing voltage produced by a coil in an alternator from any point on the sine wave graph to that point when the wave shape begins to repeat itself, we would have marked exactly one cycle of that wave. This is most easily shown by spanning the distance between identical peaks, but may be measured between any corresponding points on the graph. The degree marks on the horizontal axis of the graph represent the domain of the trigonometric sine function, and also the angular position of our simple two-pole alternator shaft as it rotates: Figure below
Alternator voltage as function of shaft position (time).
Since the horizontal axis of this graph can mark the passage of time as well as shaft position in degrees, the dimension marked for one cycle is often measured in a unit of time, most often seconds or fractions of a second. When expressed as a measurement, this is often called the period of a wave. The period of a wave in degrees is always 360, but the amount of time one period occupies depends on the rate voltage oscillates back and forth.
A more popular measure for describing the alternating rate of an AC voltage or current wave than period is the rate of that back-and-forth oscillation. This is called frequency. The modern unit for frequency is the Hertz (abbreviated Hz), which represents the number of wave cycles completed during one second of time. In the United States of America, the standard power-line frequency is 60 Hz, meaning that the AC voltage oscillates at a rate of 60 complete back-and-forth cycles every second. In Europe, where the power system frequency is 50 Hz, the AC voltage only completes 50 cycles every second. A radio station transmitter broadcasting at a frequency of 100 MHz generates an AC voltage oscillating at a rate of 100 million cycles every second.
Prior to the canonization of the Hertz unit, frequency was simply expressed as “cycles per second.” Older meters and electronic equipment often bore frequency units of “CPS” (Cycles Per Second) instead of Hz. Many people believe the change from self-explanatory units like CPS to Hertz constitutes a step backward in clarity. A similar change occurred when the unit of “Celsius” replaced that of “Centigrade” for metric temperature measurement. The name Centigrade was based on a 100-count (“Centi-”) scale (“-grade”) representing the melting and boiling points of H2O, respectively. The name Celsius, on the other hand, gives no hint as to the unit's origin or meaning.
Period and frequency are mathematical reciprocals of one another. That is to say, if a wave has a period of 10 seconds, its frequency will be 0.1 Hz, or 1/10 of a cycle per second:

An instrument called an oscilloscope, Figure below, is used to display a changing voltage over time on a graphical screen. You may be familiar with the appearance of an ECG or EKG (electrocardiograph) machine, used by physicians to graph the oscillations of a patient's heart over time. The ECG is a special-purpose oscilloscope expressly designed for medical use. General-purpose oscilloscopes have the ability to display voltage from virtually any voltage source, plotted as a graph with time as the independent variable. The relationship between period and frequency is very useful to know when displaying an AC voltage or current waveform on an oscilloscope screen. By measuring the period of the wave on the horizontal axis of the oscilloscope screen and reciprocating that time value (in seconds), you can determine the frequency in Hertz.
Time period of sinewave is shown on oscilloscope.
More>>
Graph of AC voltage over time (the sine wave).
In the voltage plot from an electromechanical alternator, the change from one polarity to the other is a smooth one, the voltage level changing most rapidly at the zero (“crossover”) point and most slowly at its peak. If we were to graph the trigonometric function of “sine” over a horizontal range of 0 to 360 degrees, we would find the exact same pattern as in Table below.
Trigonometric “sine” function.
| Angle (o) | sin(angle) | wave | Angle (o) | sin(angle) | wave |
|---|---|---|---|---|---|
| 0 | 0.0000 | zero | 180 | 0.0000 | zero |
| 15 | 0.2588 | + | 195 | -0.2588 | - |
| 30 | 0.5000 | + | 210 | -0.5000 | - |
| 45 | 0.7071 | + | 225 | -0.7071 | - |
| 60 | 0.8660 | + | 240 | -0.8660 | - |
| 75 | 0.9659 | + | 255 | -0.9659 | - |
| 90 | 1.0000 | +peak | 270 | -1.0000 | -peak |
| 105 | 0.9659 | + | 285 | -0.9659 | - |
| 120 | 0.8660 | + | 300 | -0.8660 | - |
| 135 | 0.7071 | + | 315 | -0.7071 | - |
| 150 | 0.5000 | + | 330 | -0.5000 | - |
| 165 | 0.2588 | + | 345 | -0.2588 | - |
| 180 | 0.0000 | zero | 360 | 0.0000 | zero |
The reason why an electromechanical alternator outputs sine-wave AC is due to the physics of its operation. The voltage produced by the stationary coils by the motion of the rotating magnet is proportional to the rate at which the magnetic flux is changing perpendicular to the coils (Faraday's Law of Electromagnetic Induction). That rate is greatest when the magnet poles are closest to the coils, and least when the magnet poles are furthest away from the coils. Mathematically, the rate of magnetic flux change due to a rotating magnet follows that of a sine function, so the voltage produced by the coils follows that same function.
If we were to follow the changing voltage produced by a coil in an alternator from any point on the sine wave graph to that point when the wave shape begins to repeat itself, we would have marked exactly one cycle of that wave. This is most easily shown by spanning the distance between identical peaks, but may be measured between any corresponding points on the graph. The degree marks on the horizontal axis of the graph represent the domain of the trigonometric sine function, and also the angular position of our simple two-pole alternator shaft as it rotates: Figure below
Alternator voltage as function of shaft position (time).
Since the horizontal axis of this graph can mark the passage of time as well as shaft position in degrees, the dimension marked for one cycle is often measured in a unit of time, most often seconds or fractions of a second. When expressed as a measurement, this is often called the period of a wave. The period of a wave in degrees is always 360, but the amount of time one period occupies depends on the rate voltage oscillates back and forth.
A more popular measure for describing the alternating rate of an AC voltage or current wave than period is the rate of that back-and-forth oscillation. This is called frequency. The modern unit for frequency is the Hertz (abbreviated Hz), which represents the number of wave cycles completed during one second of time. In the United States of America, the standard power-line frequency is 60 Hz, meaning that the AC voltage oscillates at a rate of 60 complete back-and-forth cycles every second. In Europe, where the power system frequency is 50 Hz, the AC voltage only completes 50 cycles every second. A radio station transmitter broadcasting at a frequency of 100 MHz generates an AC voltage oscillating at a rate of 100 million cycles every second.
Prior to the canonization of the Hertz unit, frequency was simply expressed as “cycles per second.” Older meters and electronic equipment often bore frequency units of “CPS” (Cycles Per Second) instead of Hz. Many people believe the change from self-explanatory units like CPS to Hertz constitutes a step backward in clarity. A similar change occurred when the unit of “Celsius” replaced that of “Centigrade” for metric temperature measurement. The name Centigrade was based on a 100-count (“Centi-”) scale (“-grade”) representing the melting and boiling points of H2O, respectively. The name Celsius, on the other hand, gives no hint as to the unit's origin or meaning.
Period and frequency are mathematical reciprocals of one another. That is to say, if a wave has a period of 10 seconds, its frequency will be 0.1 Hz, or 1/10 of a cycle per second:
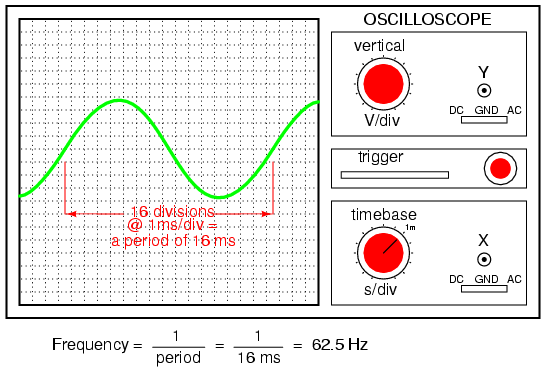
An instrument called an oscilloscope, Figure below, is used to display a changing voltage over time on a graphical screen. You may be familiar with the appearance of an ECG or EKG (electrocardiograph) machine, used by physicians to graph the oscillations of a patient's heart over time. The ECG is a special-purpose oscilloscope expressly designed for medical use. General-purpose oscilloscopes have the ability to display voltage from virtually any voltage source, plotted as a graph with time as the independent variable. The relationship between period and frequency is very useful to know when displaying an AC voltage or current waveform on an oscilloscope screen. By measuring the period of the wave on the horizontal axis of the oscilloscope screen and reciprocating that time value (in seconds), you can determine the frequency in Hertz.
Time period of sinewave is shown on oscilloscope.
More>>
- REVIEW:
- AC produced by an electromechanical alternator follows the graphical shape of a sine wave.
- One cycle of a wave is one complete evolution of its shape until the point that it is ready to repeat itself.
- The period of a wave is the amount of time it takes to complete one cycle.
- Frequency is the number of complete cycles that a wave completes in a given amount of time. Usually measured in Hertz (Hz), 1 Hz being equal to one complete wave cycle per second.
- Frequency = 1/(period in seconds)
0 comments:
Post a Comment